

MALT is originally developped to support C. By extension it allows suporting all compatible languages.

MALT natively translate the symbols from C++ to get them readable.

MALT also supports natively the Fortran language.

MALT also supports natively the Rust language.

MALT also now extends to support Python, currently experimental.
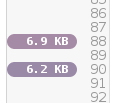
MALT provides code annotations to map allocation metrics directly onto your source code. It also uses human readable units (KB, GB...).
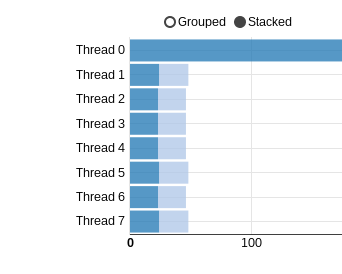
You get statistics about usage of memory functions over threads.
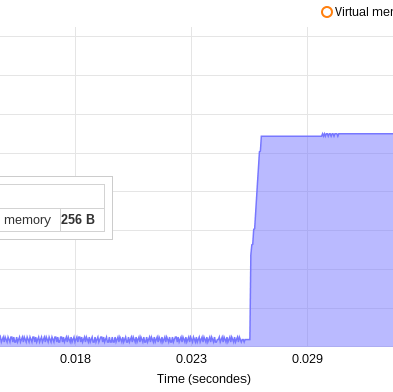
It provides some metrics over time, like : number of allocation, allocation rates, usage of virtual, physical and requested memory.
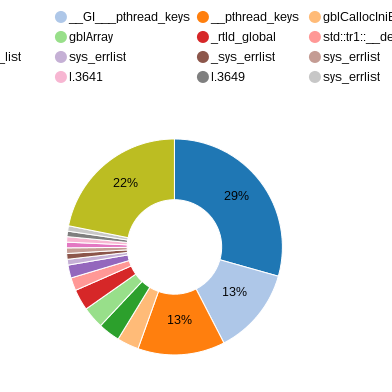
In some applications (e.g. FORTRAN) global variables or TLS can use a large amount of memory. MALT also track them for all linked libraries.
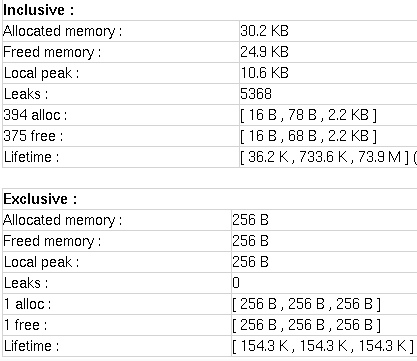
Additionally to memory size MALT also give you some allocation properties like minimal and maximal lifetime of chunks linked to call sites.
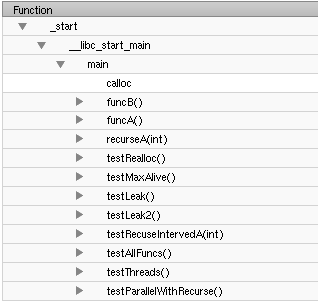
Memory allocations are also projected on call stacks.

Similar to KCachgrind call tree chart, MALT annotate the call tree and permit to dig in.
Most memory tools provide information about malloc but not on free. MALT also points the call sites using free in the annotated sources.
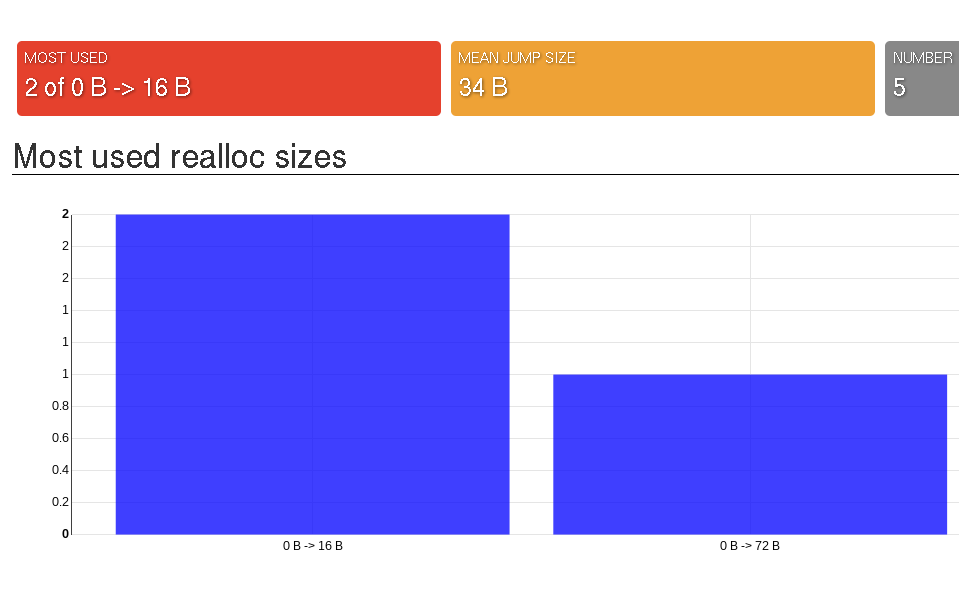
You can easily get statistics about sizes used in malloc but most of the time you don't get the one from realloc. MALT does.

MALT also helps for performance by giving you hint about the lifetime of your allocations.

The tool provides a complete allocation profile on stacks at peak time. Hence, you can reduce the memory footprint of your app.

As for valgrind memcheck MALT provide the complete list of non-freed chunks at exit time.

Thanks to time profile of virtual vs. requested memory, MALT can spot fragmentation if effect is big. Still need to improve the way to track the origin.

MALT can help you to detect allocations you don't expect, for example added by the compiler (in FORTRAN) or libs.
All apps have tiny allocations (e.g. 1B). MALT can find them easily to check if there is not too much of them.

MALT helps to track short life chunks allocated in short for loops. It helps to the performance of your application.

MALT uses a web-based GUI hosted by an embedded server in NodeJS. The GUI uses JS libraries like AngularJS and D3JS.
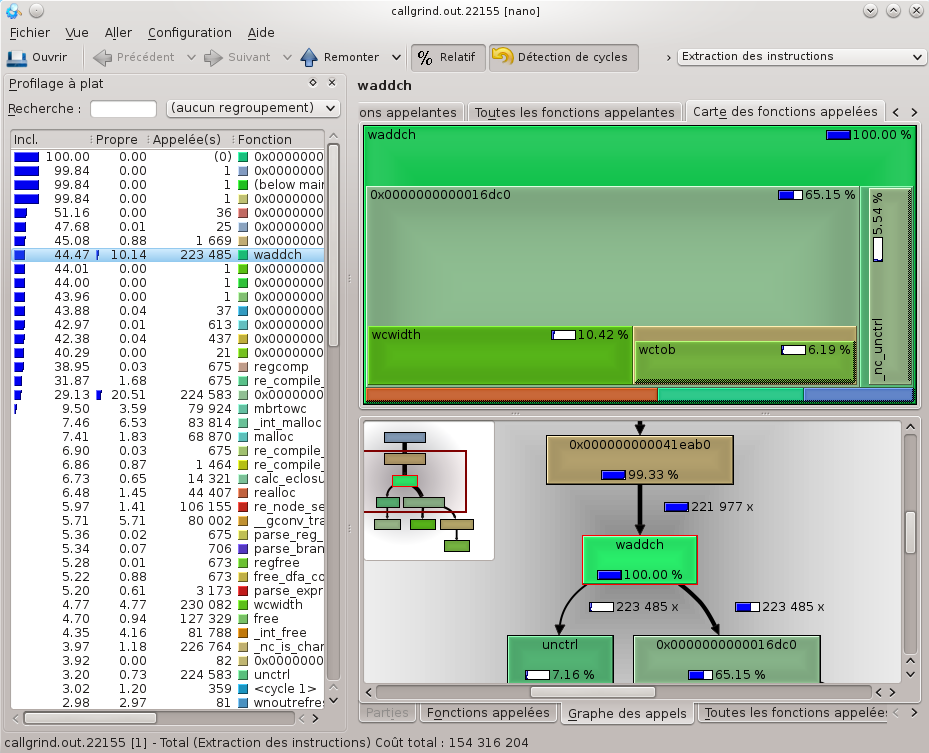
MALT can generate output files compatible with KCachgrind. It cannot use all the metrics but can be enough for you.
The web GUI allows to export charts in SVG format or extract the data in JSON or CSV format. Useful for your reports.

MALT uses a JSON file format, so might be reused without too much effort by other software. The drawback is that it produces bigger files.

MALT takes care to ignore the allocations done by itself in all profiles. It also uses his own allocator not to change the memory layout of your application.

We do not use a snapshot approach to contrast with valgrind massif or TCMalloc profiler. Thanks to this we do not miss what append between snapshots.

MALT use a profile approach so map the memory metrics on the call stack or on time with sampling.

Unlike valgrind MALT is parallel and only be slow down by the backtrace calls. It can get large overhead if you do millions/billions of allocations.