
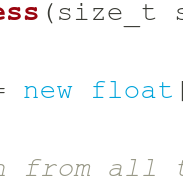
NUMAPROF provides code annotations to map allocation metrics directly onto your source code.
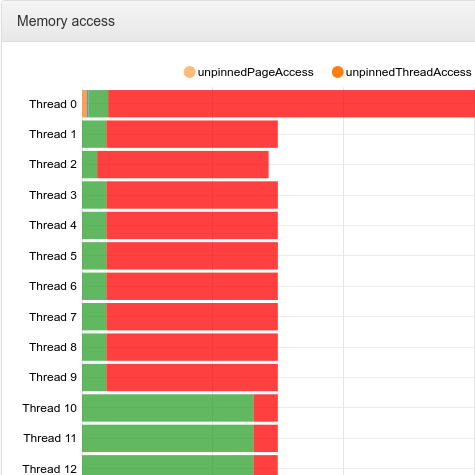
You get some statistics about memory accesses over threads.
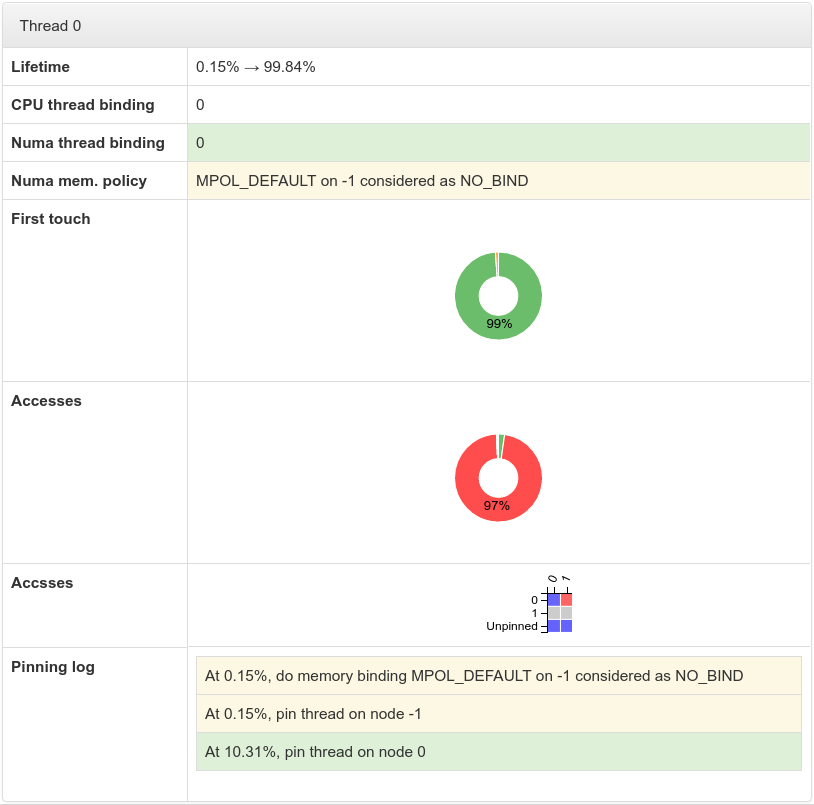
Track all the thread pinning history and statistics to better understand your profile.
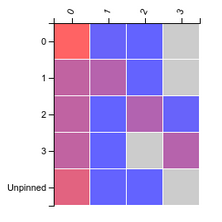
Profide a global and per thread access matrix to better understand the global balancing over your nodes.
Report remote/local accesses on access site and on allocation site to quickly find segments generating remote acceses.
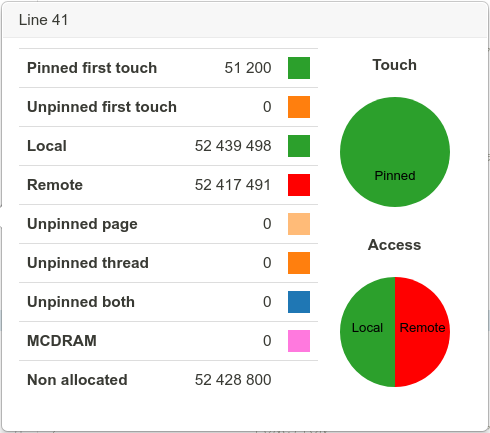
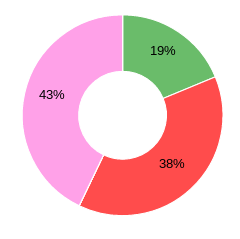
When you put your mouse on access line you get all the details on this line with charts.
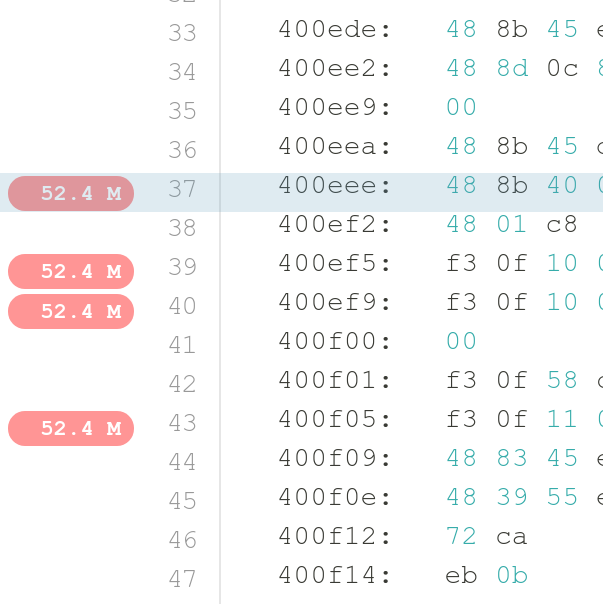
In addition to the source code annotation NUMAPROF annotate the assembly code to understand accesses at fine grain.
NUMAPROF provide a special instrumentation to track Intel KNL MCDRAM accesses.

NUMAPROF track pinning of threads and pages to detect unpinned (undefined) behavior which can be improved.
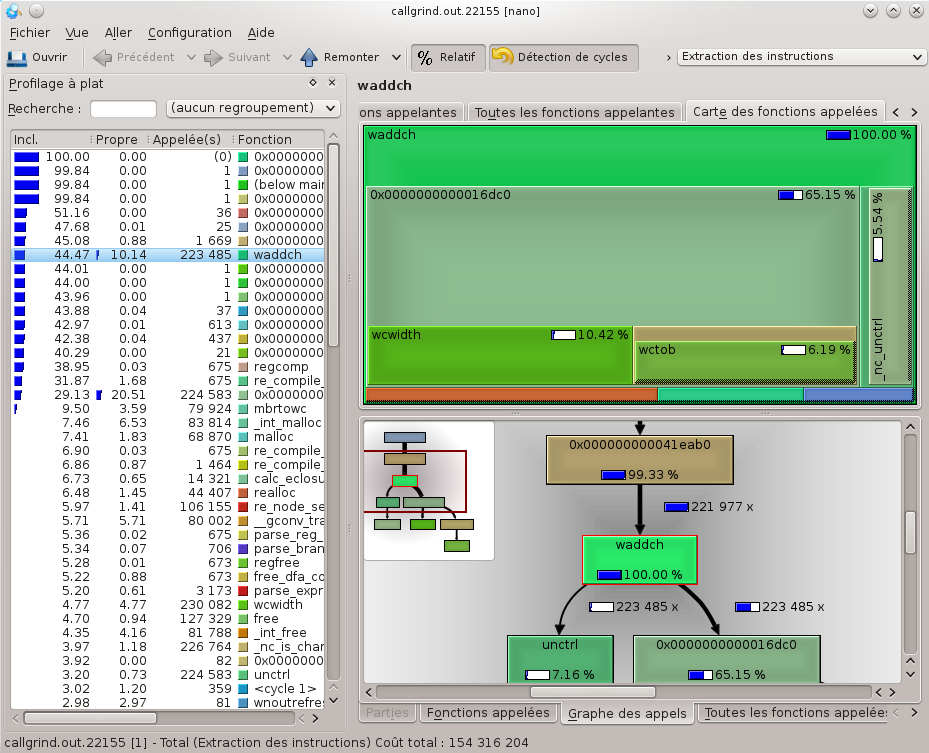
NUMAPROF can convert is native output format to callgrind compatible format.

NUMAPROF uses a web-based GUI hosted by an embedded server in python. The GUI uses JS libraries like JQuery and D3JS.

NUMAPROF uses a JSON file format, so might be reused without too much effort by other software. The drawback is that it produces bigger files.

To get faster NUMAPROF do no instrument the local stack accesses, this largely reduce the overhead.

NUMAPROF track the first touch which determines the page location and report the in the profile.

Unlike valgrind and thanks to pintool, NUMAPROF is parallel and only be slow down by the binary instrumentation.
The typical overhead of NUMAPROF is 40x depending on how much you access your stack or heap.